Venn diagrams are a powerful tool for visualizing relationships between different sets of data. Although there is no native feature to draw a Venn diagram in Google Docs, you can create a new one from scratch! In fact, the entire process should take no more than a minute for a basic two-circle diagram.
In the following tutorial, I’m going to show you a beginner-friendly guide on how to make a Venn diagram in Google Docs. I will also show you a trick to make the colors from circles overlap, creating a new shade in the middle — a character that is significant for a good Venn diagram.
Alright, let’s get into it!
Table of Contents
How to Make a Simple Venn Diagram in Google Docs
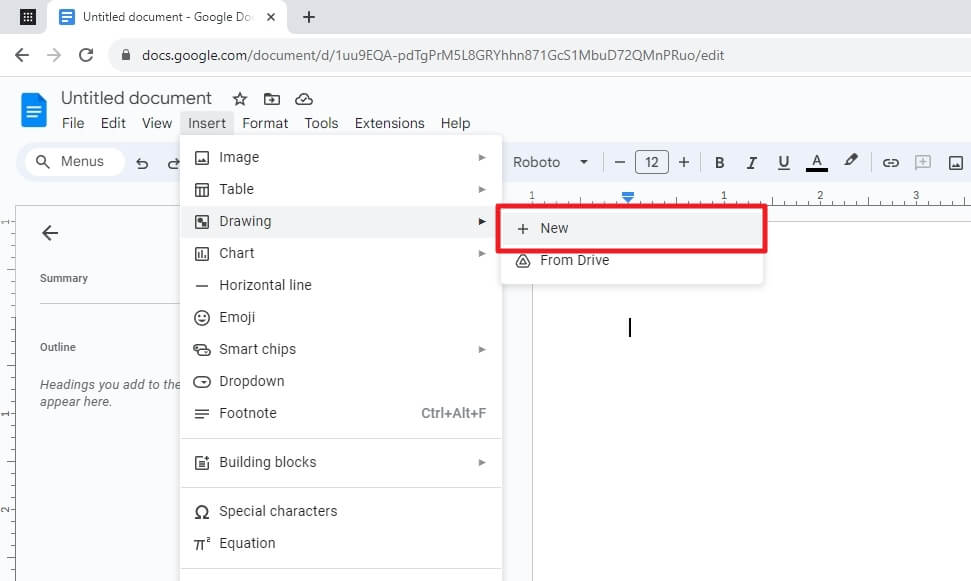
1. First, go to Insert > Drawing > New.
2. Now, click Shape > Shapes > Oval.
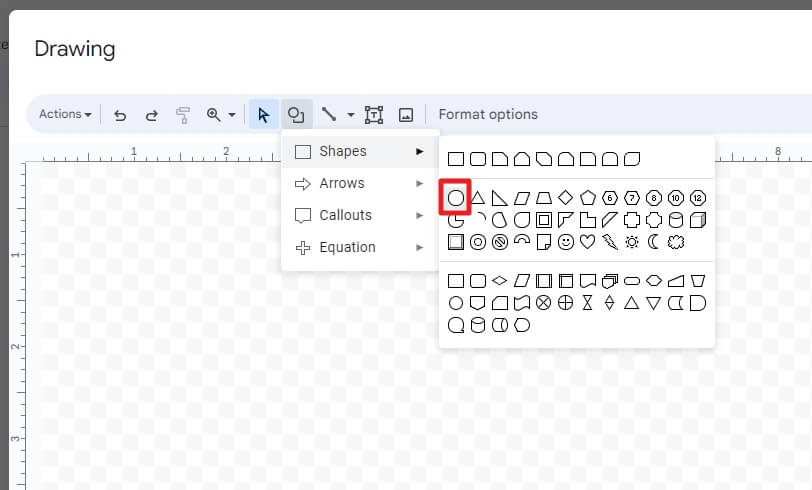
3. Draw two circles that overlap one another. To make a perfect circle, press and hold the Ctrl key when drawing the circle.
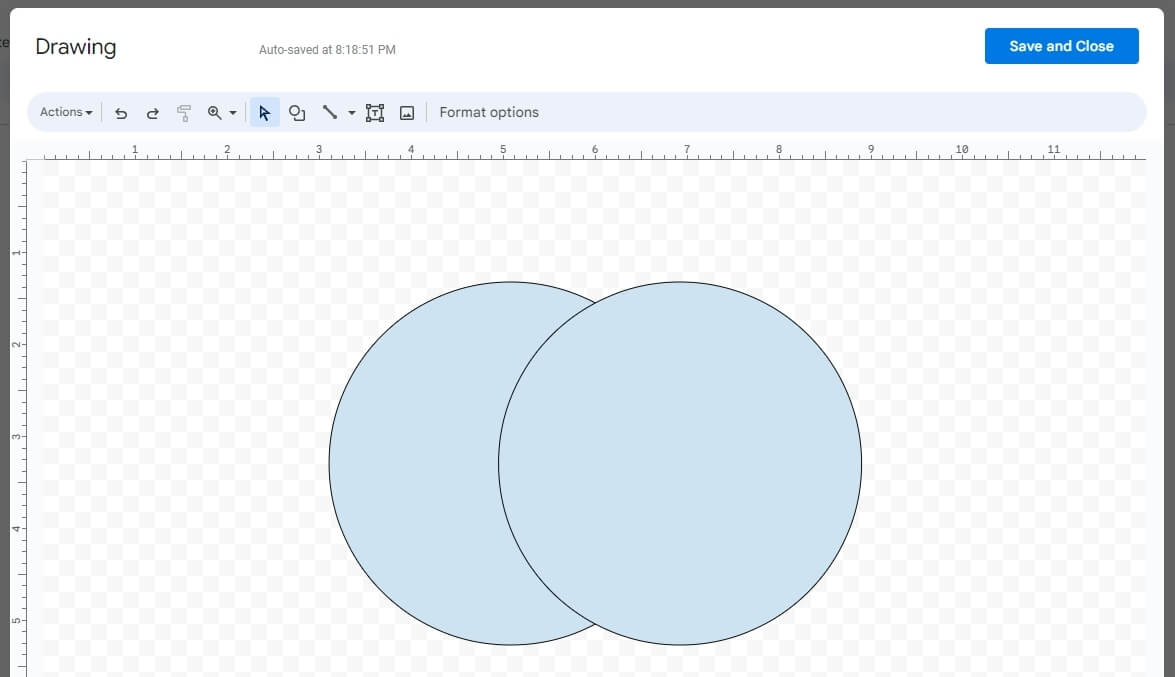
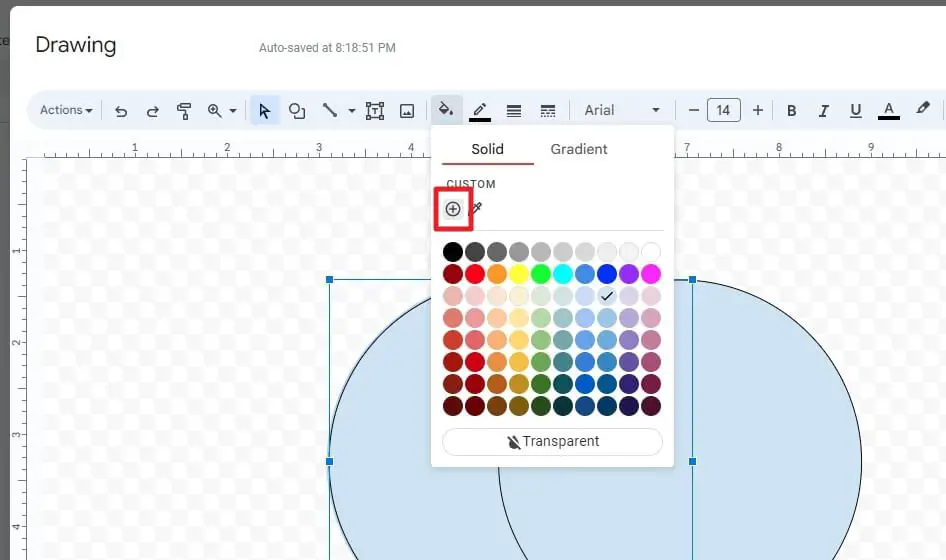
4. To add a transparent color to the circle, click on a circle, go to Fill color, and then select Add a custom color.
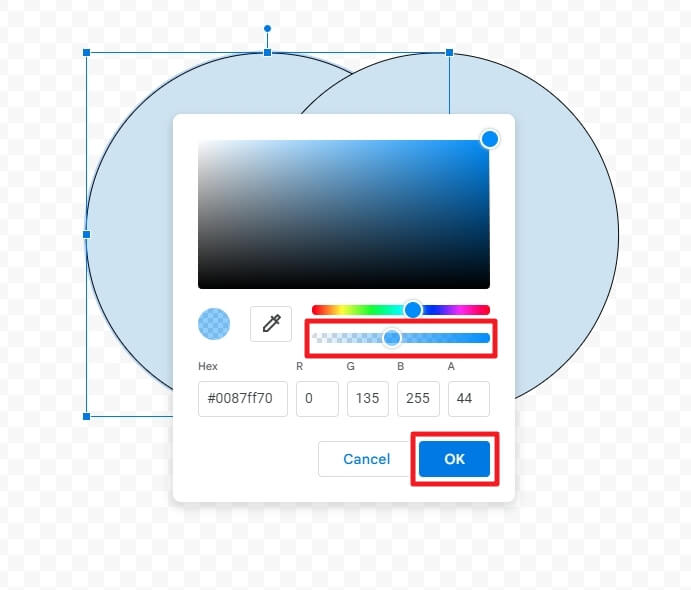
5. Select a color and make sure to add some transparency to the color. This will enable colors from two circles to combine. Then, hit OK.
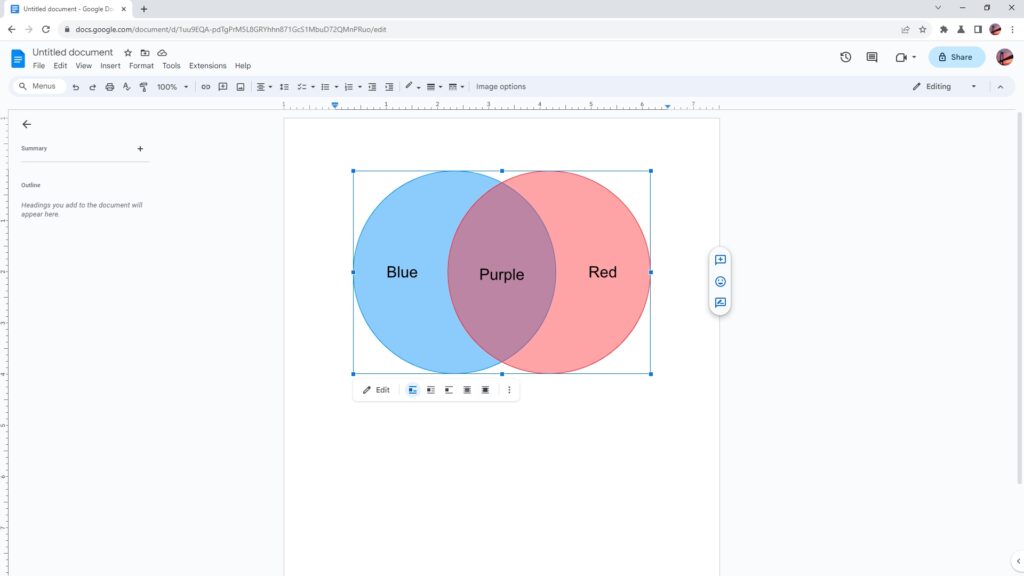
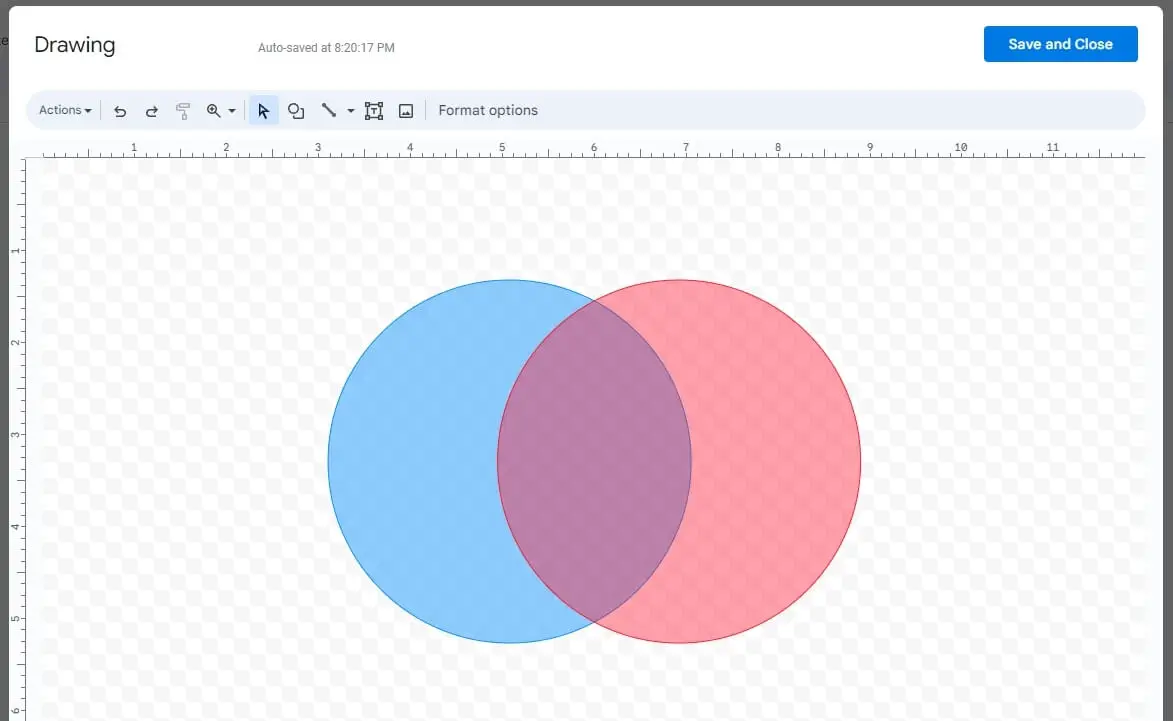
6. Add a different transparent color for the other circle. The result would look something similar to this.
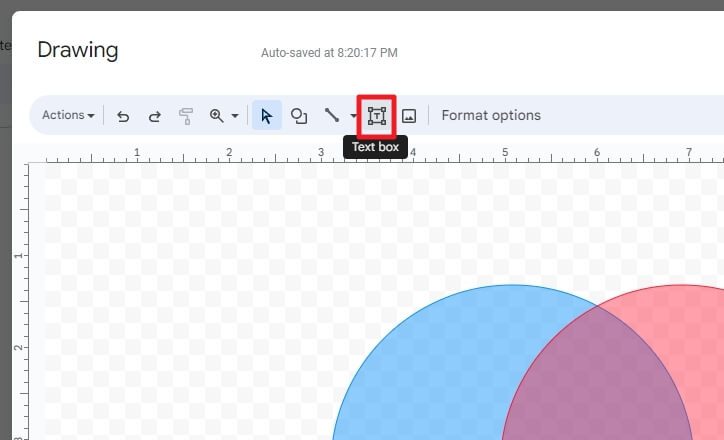
7. Click Text box to start writing on the Venn diagram.
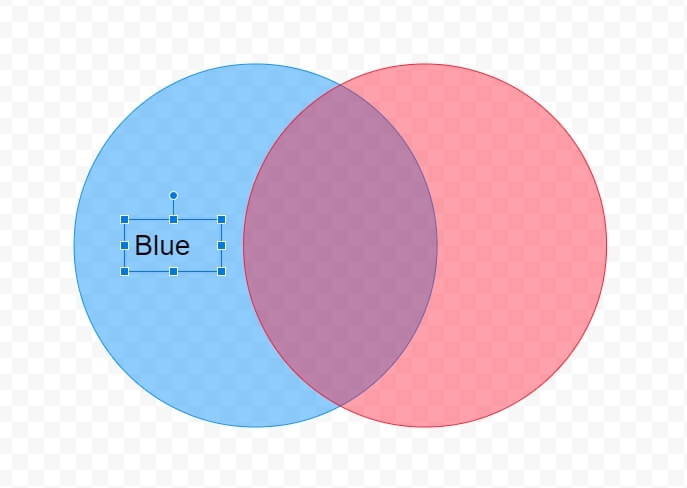
8. Add some text on each circle as well as the overlap area.
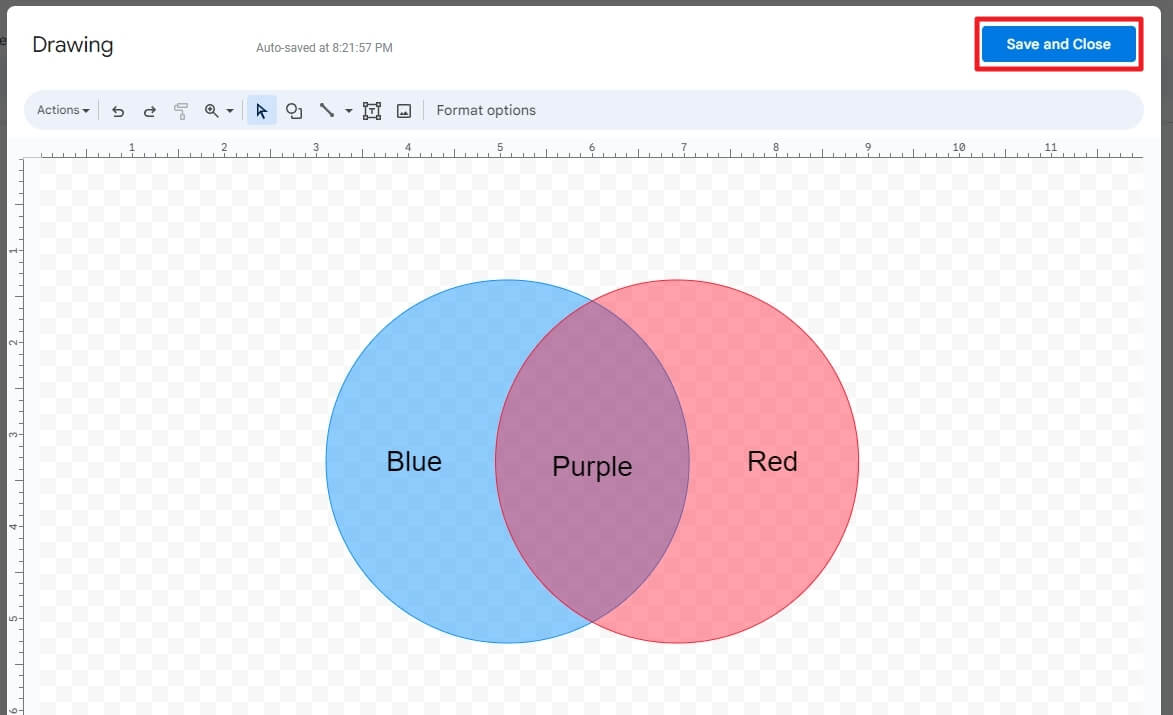
9. Lastly, click Save and Close.
10. Voila! You have just created a Venn diagram in Google Docs. Of course, it’s not limited to this design. You may add more circles, text boxes, and other decorations to make the diagram more compelling.
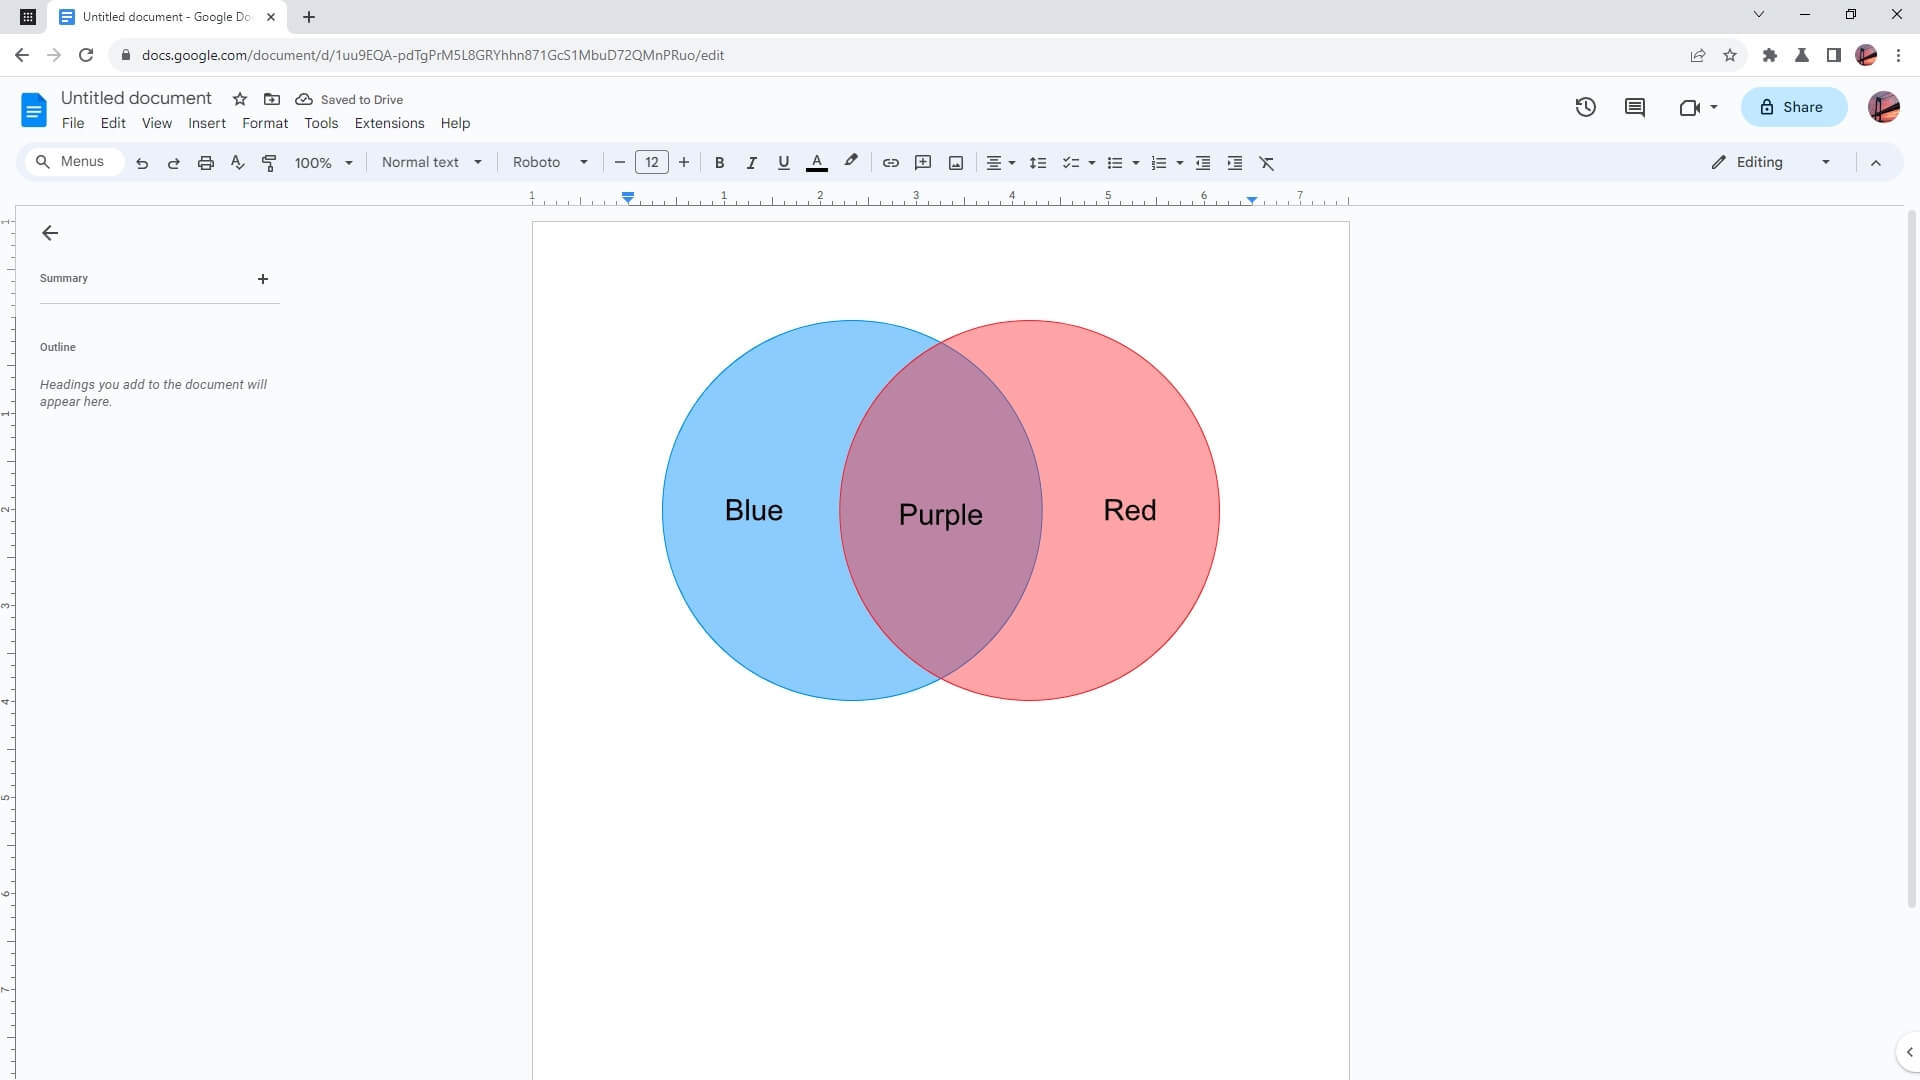
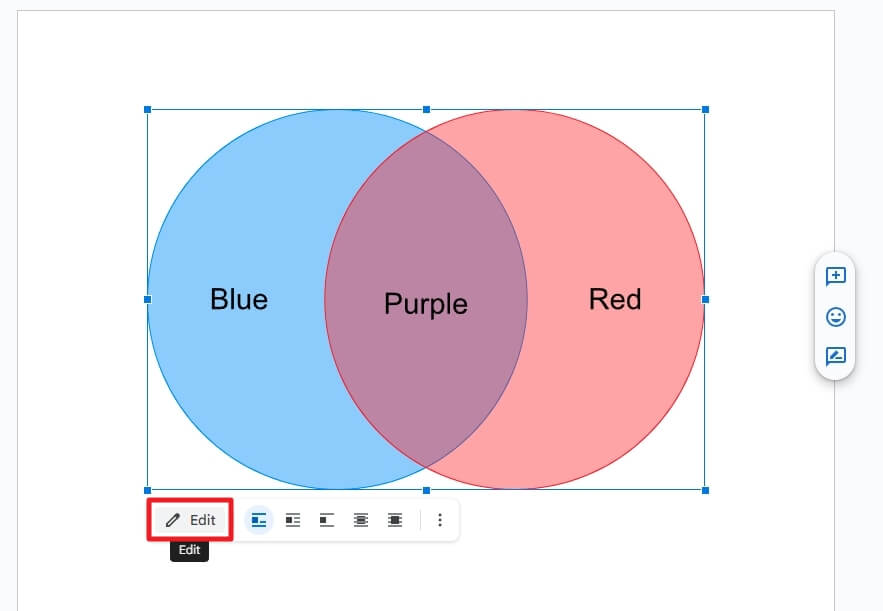
Notice the combination of transparent blue and red creates purple in the middle. Pretty cool isn’t it?
How to modify the Venn diagram later
The Venn diagram you just created is not set in stone. If you made a mistake in the design or if you wish to change the color, just click on the diagram and then hit Edit. This action will bring you back to the Drawing window where all the editing tools can be used.
Frequently Asked Questions
Is there a Venn diagram template in Google Docs?
No, there is no pre-made Venn diagram template in Google Docs. However, there are many ways to create a Venn diagram in Google Docs using the built-in Drawing tool or third-party add-ons like Creately and GPT Diagram Maker.
How do I make a Venn diagram in Google Docs?
To make a Venn diagram in Google Docs, use the Insert > Drawing > New. Then, add two circles using the Shapes tool and arrange them in the format of a Venn diagram. Consider adding transparent colors for the circles to make them look better. Then, add some text with Text boxes and finally click Save and Close.
How do you make overlapping circles in Google Docs?
To make overlapping circles in Google Docs, use the Insert > Drawing > New. Click Shape > Shapes > Oval and then draw two circles. Click on a circle, go to Fill color > Add a custom color. Select a color, adjust the transparency level, and hit OK. Do the same thing for the other circle. Then, click Save and Close.

