A flowchart is a graphical representation of a process or workflow that can be used as an organizational aid. In this article, we will walk you through the process of creating a flowchart in Google Docs by using the program’s in-built drawing tool.
Flowcharts, which are schematics that show a process, workflow, or algorithm using symbols and shapes rather than actual pictures, have been around for decades. Flowcharts are diagrams that employ symbols and shapes. It is believed that engineers Frank and Lillian Gilbreth were the first people to utilize a flowchart to document the flow of a process in the year 1921.
Google Docs is a versatile program that may be used to collaborate on projects. Not only can you write and format text documents with its built-in drawing tool, but you can also construct a custom flowchart and a project schedule using Google Docs. These features are in addition to the fact that you can write and format text documents.
Now that everything is set up and ready to go, let’s get down to business and create a flowchart.
Step 1. Open a Google document. You can do that by typing docs.google.com into your browser’s address bar. Create a new blank Google document after signing in.


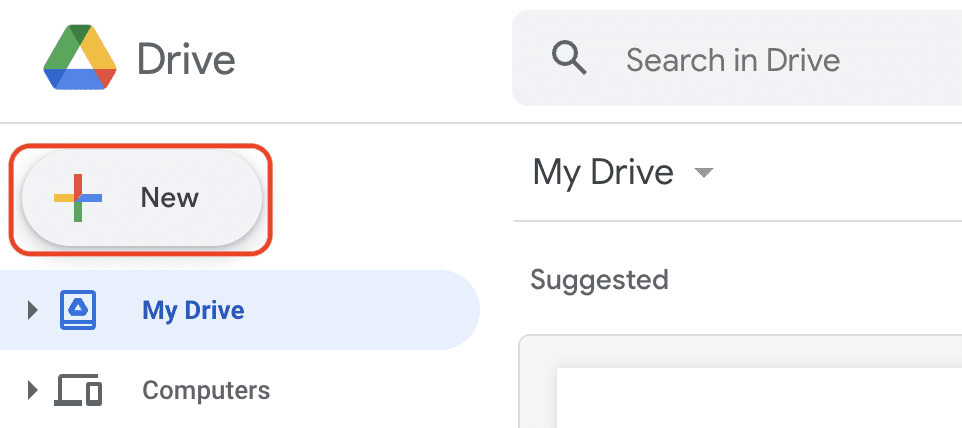
Step 2. You can also access Google Docs by going to drive.google.com, signing in, selecting the “+ New” button on the top left of the page, and selecting “Google Docs” from the list of available alternatives. A new tab with a document without a title will open. Please identify the document.

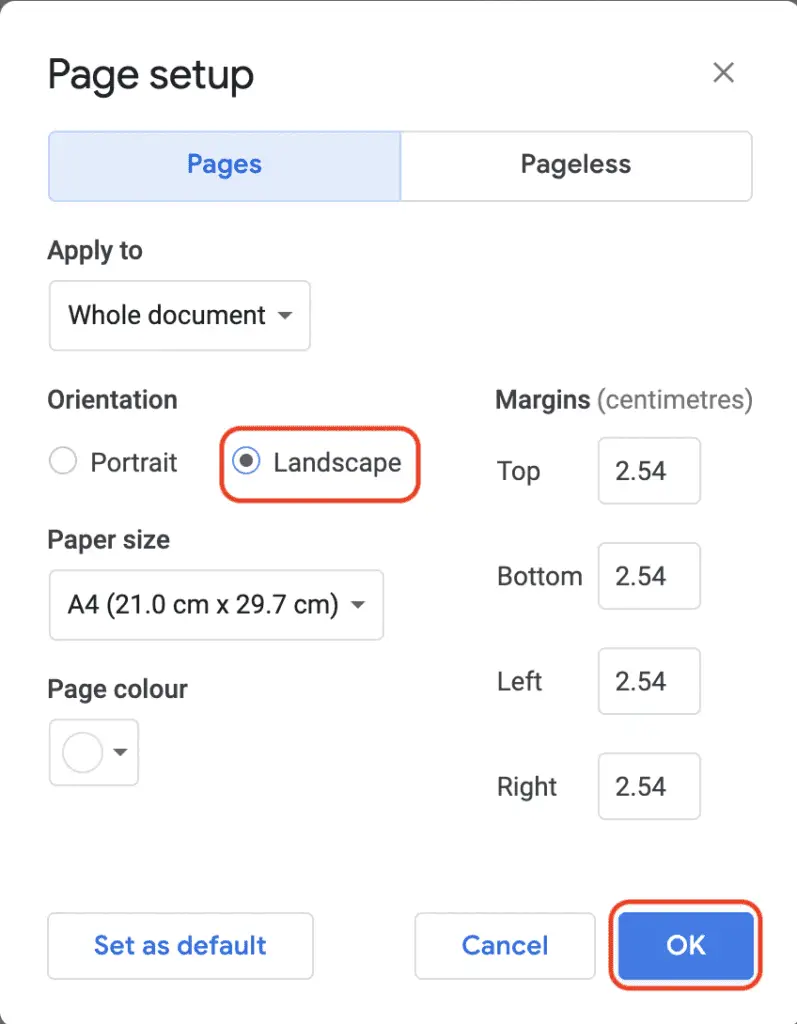
Step 3. If your flowchart is horizontal, you can alter the page’s orientation from portrait to landscape by going to the File tab on the menu bar, selecting “Page setup,” then choosing “Landscape.” This will shift the orientation of the page.

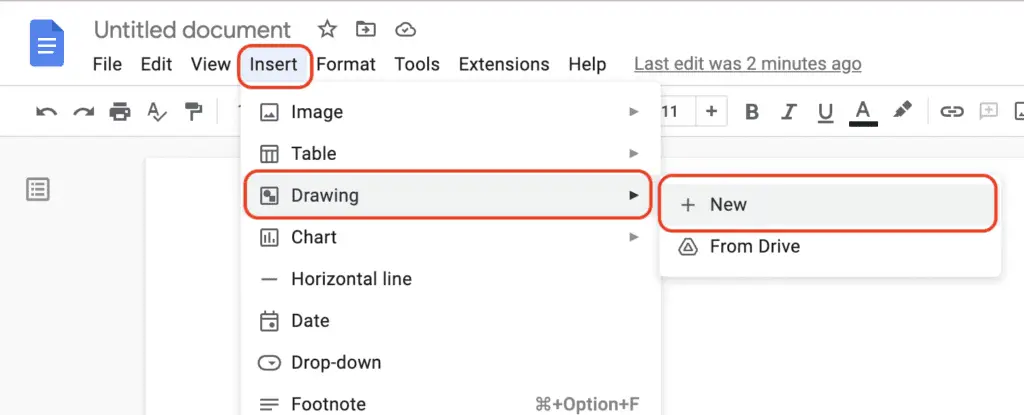
Step 4. Open Google’s drawing tool. To design a flowchart, we will use the diagramming tool available on Google Docs. To accomplish this, select “Insert” from the menu bar located at the very top of the screen, move your mouse pointer over the “Drawing” option, and then click on the “+ New” button.

Step 5. On top of the document, you’re working on in Google.
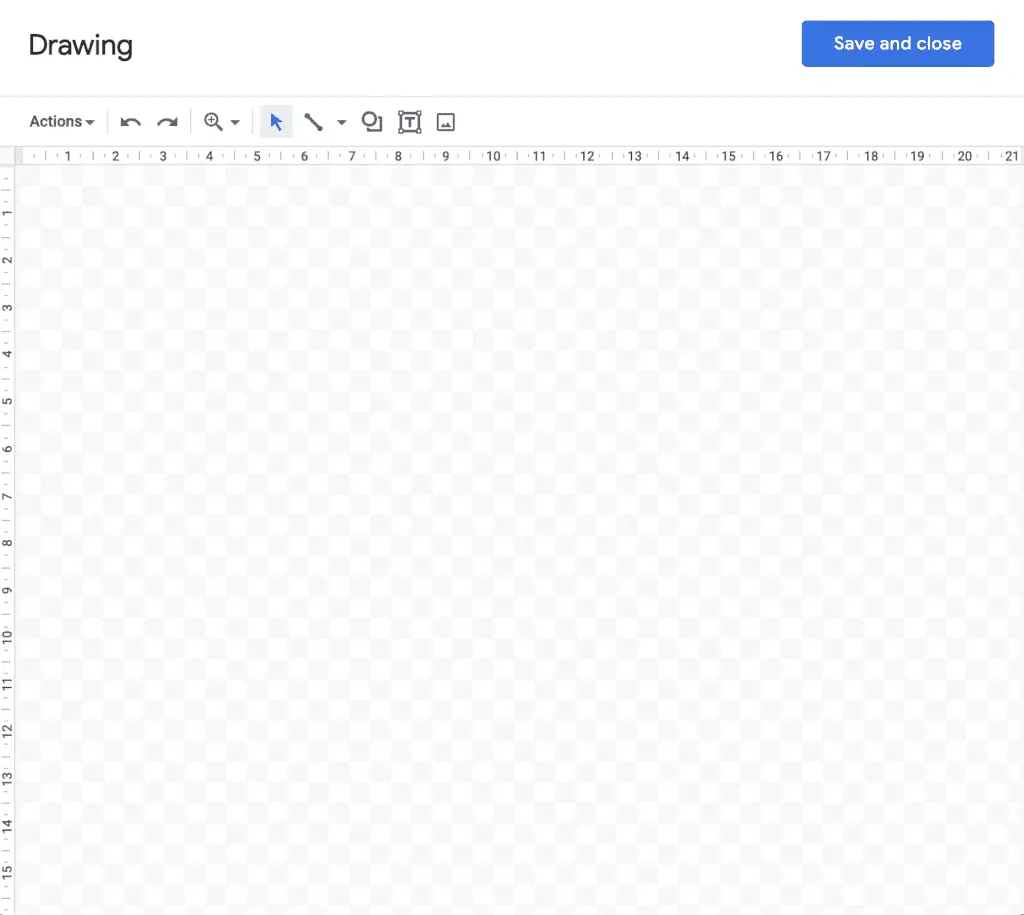

Step 6. On the drawing toolbar, click on the Shapes tool (the icon with the circle and square to the left of the boxed “T”), and then select “Shapes” from the list of options to view the various flowcharting items. The bottom half of the menu is where you’ll find the many flowcharting shapes to choose from.
If you aren’t familiar with the various forms and what they represent, you can learn what purpose each object serves by hovering the mouse pointer over it and reading the information that appears.
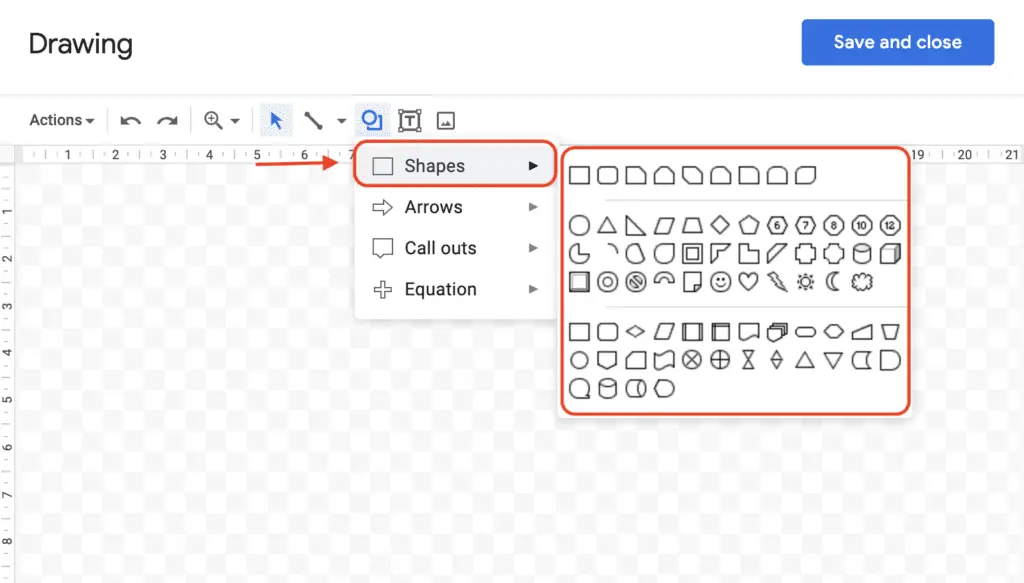

Step 7. Include shape. A flowchart will be created as an illustration of this guide’s contents as an example. Our flowchart will be titled “How to Make a Flowchart in Google Docs” for the time being. Choose the flowchart terminator, also known as the rounded rectangle, from the Shapes menu to start the process.
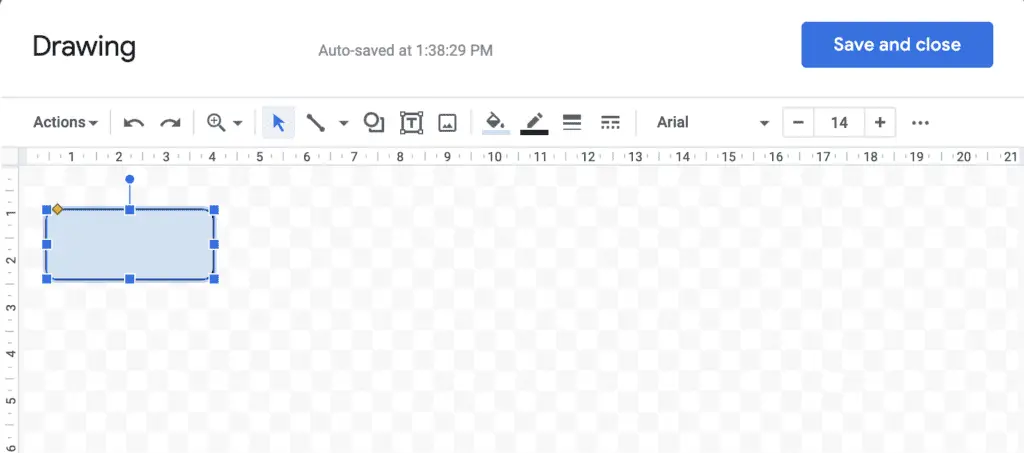

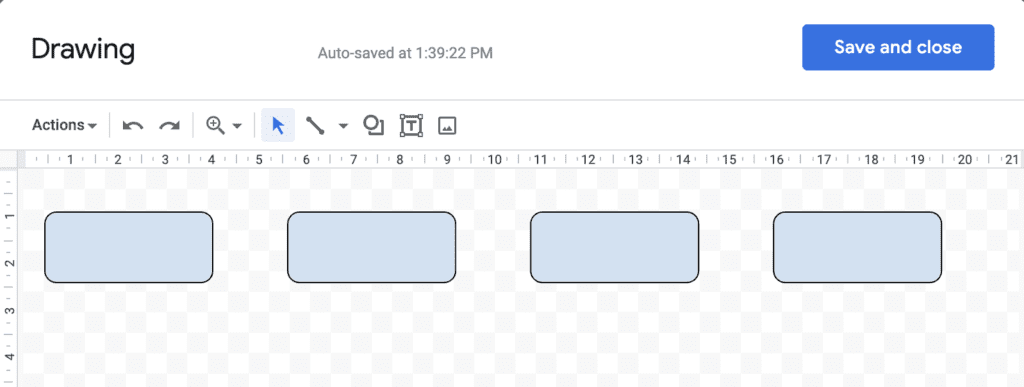
Step 8. You’ll need to add each form or thing to your list. It would be helpful if you could copy and paste the shapes, so they are all the same size.

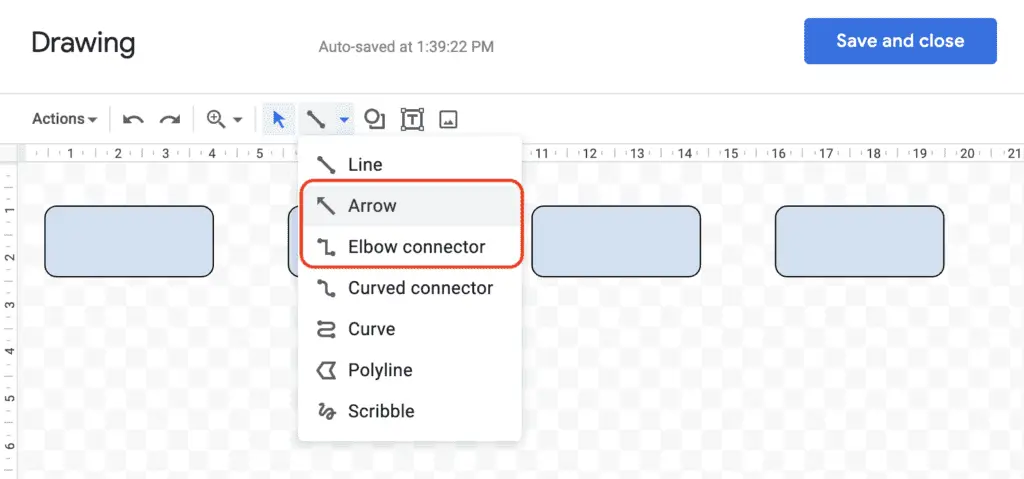
Step 9. Add arrows. To create your arrows or flowlines, go to the toolbar and click on the Line tool. Then, depending on the type you require, choose “Arrow” or “Elbow Connector” from the drop-down option that appears after clicking on the Line tool.

Step 10. Add text. The following step is to insert the corresponding text inside the shapes using the Text tool, which is represented on the drawing panel by a boxed “T” icon.
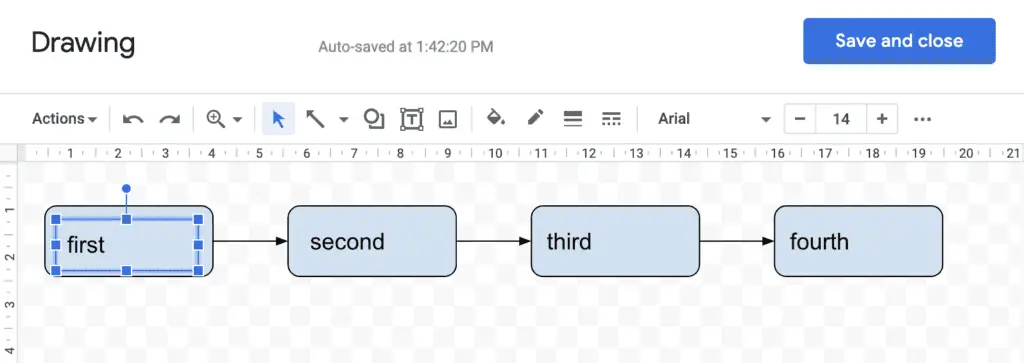

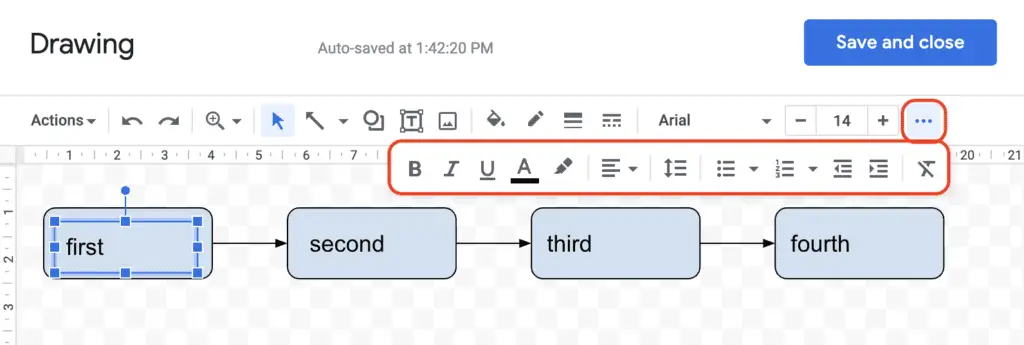
Step 11. To format the text you have selected, go to the toolbar and click on the three dots that are located there. You now have the opportunity to alter the font type, make the text larger or smaller, and align it in whichever manner you deem appropriate. To preserve the formatting of the content, copy and paste it.

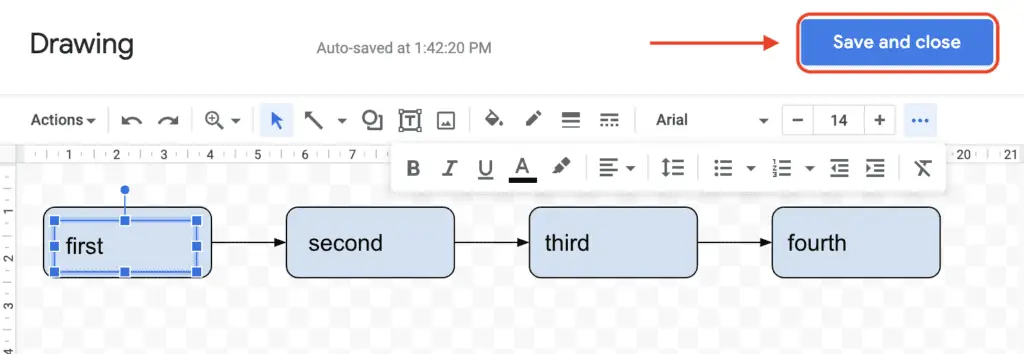
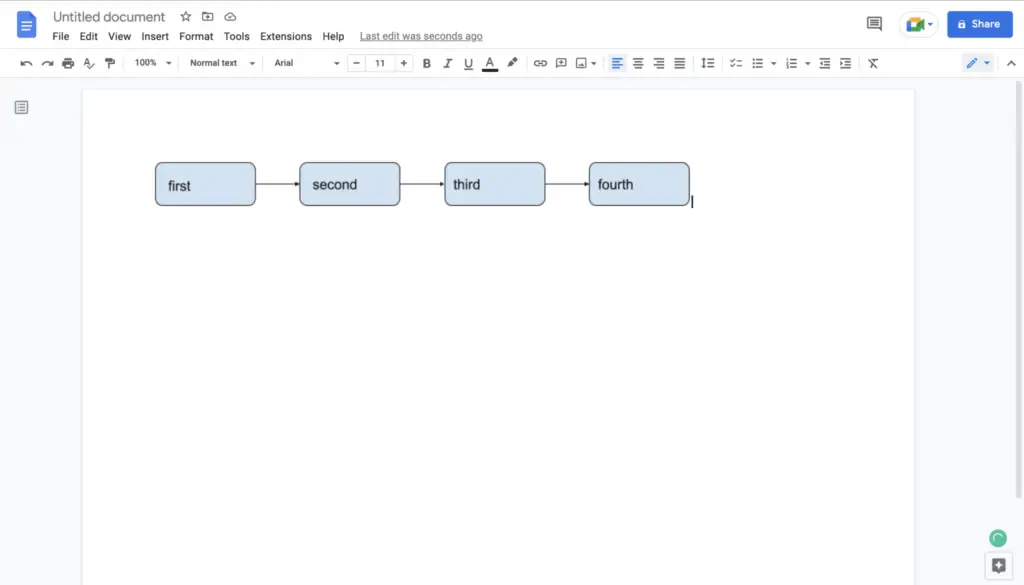
Step 12. Keep a copy of your flowchart. When you are finished, click the “Save and Close” button, which is a blue button. After that, the flowchart you provided will be added to the document you have stored on Google. If you need to make any changes, double-click anywhere on the flowchart, and you’ll be brought back to the drawing canvas, where you can make the necessary adjustments.


Flowcharts are used as visual tools in various industries, including engineering, computer programming, and even the entertainment industry. Flowcharts graphically represent processes, and their use is widespread. In the field of project management, they can contribute to the simplification of project planning, and this is true regardless of the project methodology you have selected to use, whether it is an agile adaptive project framework or project cycle management.
Creating a flowchart may be accomplished in various ways, and one excellent alternative to think about is using Google Docs. The process can quickly become monotonous and time-consuming, which is a drawback that is especially problematic for complicated flowcharts that require up to hundreds of separate objects or elements.


